Do You Know What Plants Will Thrive In Your Florida Garden?
Plant hardiness zones are “the standard by which gardeners and growers can determine which perennial plants are most likely to thrive at a location.” (USDA) You see this term when you go to the garden center. What is it and how do we use it?
First
Find Your Florida Garden displayed on a map like this one below. You will find that your garden’s plant hardiness zone is based on its average annual extreme minimum winter temperature. Notice that this information is displayed as thirteen; separate, 10-degree wide (Fahrenheit) zones that are subdivided into 5-degree half zones. If you know where your garden is located on the map (national or Florida version) you know how to judge if a particular perennial plant is going to thrive in your garden!
Save this information; your plant hardiness zone is perhaps the single most useful thing you can know about your garden! If you garden somewhere in the US, you are on this map! If you learn how to use it you can have a good look at some important facts about your garden.

Zoom To Your Garden
You are somewhere on this map, use this link to see the interactive version. Enter your zip code, and you can zoom directly to your garden’s location.
To know ‘How To Use The New USDA Plant Hardiness Zone Map.’ use this link.
Your Florida Garden
Florida has changed many times. This is the newest version of the map, published on November 15, 2023. The last version was published in 2012 and each represents approximately 30 years of data. Each successive map version uses progressively newer technology and is more detailed.
- The last map was based on data from 7973 weather stations.
- The newest map used 13625 stations.
- This map is used by 80 million gardeners and growers.
Weather Is Important To Us Gardeners!
This sounds obvious, but consider this Florida history while you are getting ready to use the new USDA Plant Hardiness Zone Map.

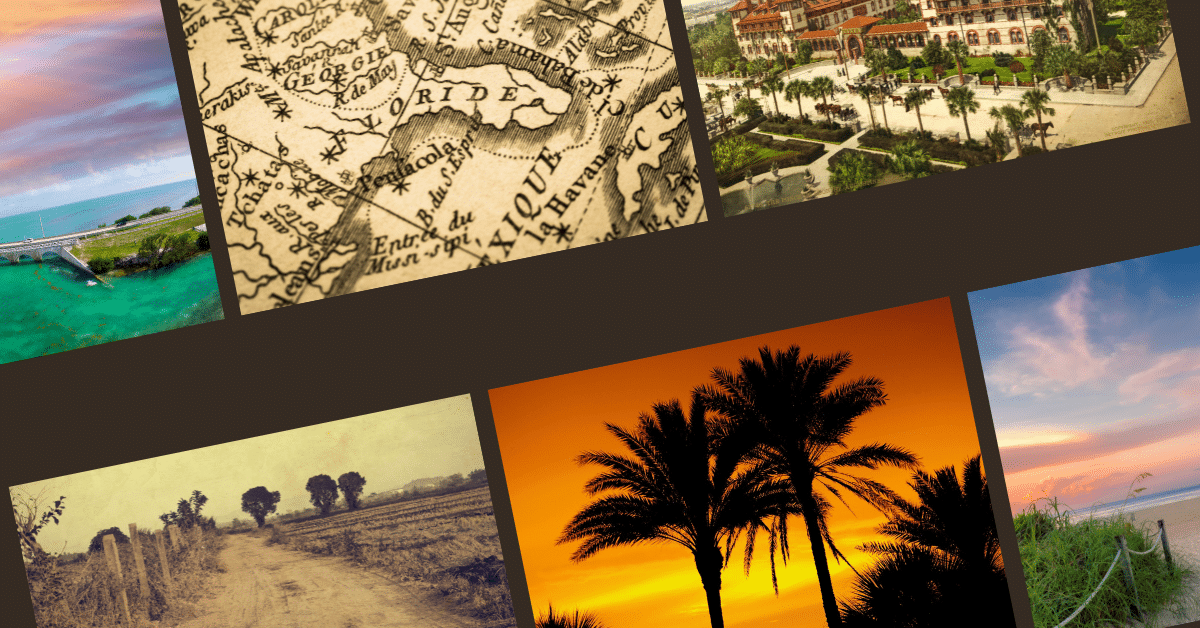
In the mid-1500s Ponce De Leon planted citrus trees in St Augustine. By the late 1800s, in Florida and the deep South, citrus was an important export industry. Growers shipped the new sweet fruit and juice from groves in North Florida, Savannah GA, and Charleston SC to hungry customers in places like Philadelphia and New York.
The railroads changed lives; they brought northerners to visit Florida and taste the refreshing fruit and then brought the crops to the markets that demanded them. Florida dominated the citrus growing industry until the devastating freezes of 1894 and 1899 put a stop to it all.
Growers are resilient, they moved the groves south for better weather. Our first Florida home was built in the 1980s on the site of a Central Florida grapefruit grove, and as the weather grew colder, the growers persisted. They continued to move farther south to avoid freezing weather. (Today, of course, there are new problems too, primarily Citrus Greening.)
It’s Florida-the bugs never quit!’
‘Right Plant-Right Zone’
Today, the new USDA Plant Hardiness Zone Map (November 15, 2023) tells us that half of the entire United States is one-half-zone (or 5 degrees F) warmer, and the Florida map shows the same trend.
We still need to know everything we can about the weather. Understanding the weather; with the right plant in the right zone, is one thing we need to do accurately. No matter how many other things we do well, failure to match a plant with the temperature it needs to stay alive is an error we must avoid!
What Does The New USDA Map Tell Us?
The Plant Hardiness Zone Map serves as our standard for knowing which perennial plants are most likely to thrive at a specific location. When you buy seeds and plants look, at the package or tag for the plant’s hardiness zones. (If it does not show a zone, ask the dealer; it is most likely sold as an annual in your locale.
(An annual is a plant that lives its entire life, seed to seed- from beginning to end in a single growing season.)
How The Map Works
The current map gives us “the mean annual extreme minimum temperature over a thirty-year period.” PRISM Climate Group.
The USDA has been collecting weather data since 1960, creating an annual average of the extreme lowest temperature days in each year. The national map has been divided into the following:
- 13 temperature zones, each covering 10 degrees Fahrenheit and each is based on a different anticipated cold temperature.
- Each of the 13 zones is subdivided into two 1/2 zones each of which is called a. and b., and covers 5 degrees F.
- Each zone is therefore uniform (they are all 10 degrees wide) and each is depicted by its half zones and color-coded on the map. Zone one is in Alaska and is chilly blue-gray and the hottest is red and is seen primarily in Puerto Rico. So zone 1a. is the coldest planting zone, and 13b. is the hottest!
- You get into your zone by entering your zip code into the space provided at the top of the interactive online map.
For more details on how to use the USDA Plant Hardiness Zone Map see this link. It is my national version of the features and changes in the new map.
Go to this link to go directly to the USDA’s Map website. This year’s new map is the most user-friendly and detailed map yet.
Steps To Take In Using The Map
First: Look at the national map on the website, this is where you enter your zip code.
- You can use the national map on the first page to enter your zip code. You will immediately be shown your zone with its average extreme cold temperature. If you also click Zoom, you will focus on your color-coded area.
- What changes were made between the 2012 and 2023 editions of the map? See below.

- This map shows the changes that took place between 2012 and 2023.
- The color indicates changed places (white means no change). Note the changes in north Florida, and coastal areas throughout the state.
- Move next to map downloads. Here you can download and use national, regional, and state maps in different resolutions.
- The regional maps will show you in color, the relationships between neighboring states.
- Note where zones are shared by multiple states in similar areas such as coastal territories.
Here Is The Southeastern Regional Map

- Your state map, in the highest resolution (300 dpi.) will give you the most detailed local data.
Florida Map-2023

The Florida Map-2012 For Comparison
Use the map below published in 2012 to see the differences over time.

Note the change to warmer zones in North Florida and in coastal areas. North Florida in 2023 no longer includes any of the colder zone 8a. Water bodies are taken into account and coastal areas are shown as warmer in many places.
Plant Hardiness Zones In Florida On The 2023 Map
- North Florida-Zones 8b-9b.
- Central Florida-Zones 9b-10a.
- South Florida-Zones 10b-11b.
‘A Regional Guide To Florida Gardening, North, Central, And South.’
Some Critical Thinking
This plant hardiness map and the zone system are a remarkable accomplishment and its ideas have been employed in creating other measures of hardiness throughout the world. And as we all know imitation is usually flattery!
However, there are always questions and criticisms. When gardeners dispute the accuracy of the data it happens at the most local level, and assuming we all understand how to use the information, it is often questioned by gardeners who know their climate.
An important takeaway is that we are dealing with good data, but based on averages and we need to use plant hardiness data combined with our knowledge to manage our gardens.
Gardening Is Not About Instant Gratification!
The information we rely on is important to us all because gardening is not about instant gratification, it is all about long-term planning and gardeners live with their mistakes! In ‘How to Use the New USDA Plant Hardiness Zone Guide’ I discuss the concept of ‘gambling gardeners.’ These are people who will intentionally grow a plant in a zone that is too hot or cold for its optimum performance. Gardeners will take this risk because they love the plant or they know something about their microclimates that suggests success.
If I understand my garden’s microclimates and desire a certain plant that grows in a zone close to mine I might take a risk for knowledge but gardening can be expensive in several ways. A tree can have a high price tag, it takes many years to grow and a ‘wrong plant in the wrong place’ can do some environmental damage too!
We garden in South Florida and our local botanical garden is working with other gardens throughout the Caribbean to develop new plant materials that seem to be growing in our zone. To me, that sounds like enhancing biodiversity and being prepared for the future.
Using Information To Make Our Own Decisions
Our last garden was in Tampa FL, close to the water and in (at that time) zone 9b. We grew two plants that we do not see in our zone 10 area today. By planting in part shade, and under oak trees to adjust the pH of our alkaline soil we grew beds of both azaleas and camellias.
This year’s plant hardiness zone map shows our old garden in Central Florida and our new garden in coastal South Florida as both being in the same zone. (The old garden is now ranked one-half zone warmer and the new garden is ranked one-half zone cooler! Both are now in zone 10a!)
Further, in our old garden, we planted impatiens, possibly the most popular of flowering annuals, they grew for us for two to three years and reached thigh-high! (And the same happened to all of our neighbors!) In our present garden, we add some of the same pretty plants in the fall and pull them up, spent and melting in May!
That does not feel like the same zone to me!
Summary,

The USDA Plant Hardiness Zone Map is a wonderful tool for us gardeners. Thoughtfully employed, it can help us avoid making the worst mistakes in the garden- planting in a temperature zone in which our plant cannot survive!
The photo above shows locally grown tropical plants for sale at an annual garden show that our Master Gardener group puts on for our community. We could not all enjoy these beautiful plants without the local growers.
We do need to use our garden knowledge and make our own decisions!
“We think in generalities, but we live in detail.”
-Alfred North Whitehead
Resources You Can Use
“How to Use the New USDA Plant Hardiness Zone Guide“